BSC203 Assignment: Project Management Portfolio: Key Deliverables and Lessons Learned
| University | Singapore University of Social Science (SUSS) |
| Subject | Introduction To Ict Research Methods |
Project Management Portfolio
A report presenting the deliverables from the specified project management activities started in tutorials (and included on the following pages). The report should include a title page, a table of contents and the following items:
1. Scope statement – from Tutorial 2 Activity 4 (use provided template) (15 marks)
2. Gantt chart – from Tutorial 3 Activity 3 part 3 (15 marks)
3. Stakeholder matrix – from Tutorial 5 Activity 3 parts 1 and 2 (15 marks)
4. Tutorial 6 Activity 1 – answers to questions in parts 2 and 4 (10 marks)
5. Tutorial 8 Activity 3 – answers to the questions in Steps 3, 6, 7, 9, 10, 11 and an image of your tracking Gantt chart at the end of Step 16 and explanation of it (25 marks)
6. Tutorial 9 Activity 3 – Lessons Learned Report (10 marks)
NOTE: Presentation (title page, a table of contents, file labelling etc.) is worth 10 marks
You may also submit supporting files such as Microsoft Project files or PDF files, but they need to be clearly listed in the table of contents as supplementary material and the file name of each should be specified there.
Tutorial 2 – Activity 4
After this activity you should add your Scope Statement to your Project Management Portfolio
A project scope statement provides a useful way of documenting the initial outline of a project. It summarises key deliverables and identifies constraints the project will face.
Imagine that a research team is planning a project to develop a prototype of a smartwatch based system that uses camera and GPS to determine what the wearer is eating – both food and quantity – in order to track energy intake and provide support to the person using it. The researchers are hoping to receive 2 years of funding from a university grant scheme and will only undertake the
project if they receive the funding.
Develop a Scope Statement for this project, using the Scope Statement Template from the LMS. Make assumptions about your proposed version of the project where necessary.
Tutorial 3 – Activity 3
After this activity you should add an image of your Gantt chart to your Project Management Portfolio
This activity adds to your Project Management knowledge by looking at how Time is managed. The tasks accomplished in the Time Management knowledge area assist you in developing a schedule for a project or a section of a project. In general, you need to work out: what activities need to be done,
and in what sequence; how long will each take, and what resources are needed. The schedule can then be monitored to make decisions about whether completing on time is feasible. The schedule can then be developed, and is usually displayed as a Gantt chart. Look at the lecture slides from
Topic 2 to refresh your memory and you can also read more about Gantt charts here http://www.gantt.com/index.htm
1. Open a copy of the tutorial on Microsoft Project you used in the last tutorial:
Schwalbe, K (2016) A Brief Guide to Microsoft Project Professional 2016
https://kathyschwalbe.files.wordpress.com/2018/08/project2016guide.pdf
2. Work through the steps described from p16 to p20 so that you are comfortable creating a work breakdown structure from scratch. Change the date option to Australian format – dd/mm/yyyy – if it is not already in that format.
3. Continue working through the Tutorial until p33 so that you have experience creating a Gantt chart. Then Go back and ADD 1 additional meaningful task to each of the phases of your project. You should now have 5 additional tasks. Don’t forget to add durations for your new tasks. Ensure that you save a copy of the file at this point as you will be submitting the Gantt chart as part of your Project Management Portfolio.
Tutorial 5 – Activity 3
After this activity you should add your answers to parts 1 and 2 to your Project Management Portfolio
This activity adds to your Project Management knowledge by looking at how project Stakeholders are identified and managed. The ultimate goal of project management is to meet or exceed stakeholder needs and expectations for a project, so you must first identify who your particular project stakeholders are.
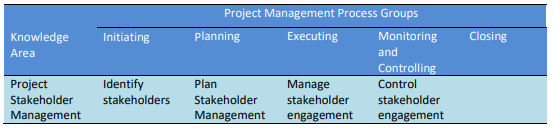
The table below maps the Project Stakeholder Management knowledge area against the project management process groups to illustrate activities associated with project stakeholders.
Hire a Professional Essay & Assignment Writer for completing your Academic Assessments
Two key outputs of this process include:
Stakeholder register: a document that includes details related to the identified project stakeholders
Stakeholder management strategy: an approach to help increase the support from stakeholders throughout the project; this often includes sensitive information You will undertake some stakeholder management activities based on the project mentioned in Activity 2 above, where researchers are planning a research project to trial 3D printing technology
to print and implant living bone cells. The participants in the project would be human patients with bone cancer, and the research team would include medical specialists, bioengineers and computer scientists.
The following resources might be of use:
A Wikipedia article on stakeholder management:
http://en.wikipedia.org/wiki/Stakeholder_management
A tutorial on stakeholder analysis: http://www.mindtools.com/pages/article/newPPM_07.htm
What you need to do:
1. Identify the project stakeholders Produce a list of 8 main project stakeholders and provide a brief description of each. Remember that
although stakeholders may be both organisations and people, ultimately you must communicate with people. Where possible identify the individual stakeholders (people or roles) who affect (or are affected by) your project (making assumptions as necessary).
Tutorial 6 – Activity 1
After this activity you should add your answers to the questions in parts 2 and 4 to your Project Management Portfolio This activity continues your work with Microsoft Project. Open the following tutorial on Microsoft Project (you used it in previous tutorials):
Schwalbe, K (2016) A Brief Guide to Microsoft Project Professional 2016
https://kathyschwalbe.files.wordpress.com/2018/08/project2016guide.pdf
Gantt chart is the default view in Microsoft Project 2016, but network diagrams (a.k.a. PERT diagrams) can be used to more clearly show the task dependencies.
1. Read pp 33-36 in A Brief Guide to Microsoft Project Professional 2016 (up to the “Project Cost and Resource Management” section) for information on network diagrams and critical path analysis, then read pp 13-15 for further information about reports.
2. Download the file named LiteratureReviewGantt.mpp from the LMS and open it in Microsoft Project. On the Format tab, click the Critical Tasks checkbox and notice that the critical tasks now display in red.
a. Explain what a critical path is.
b. Which tasks in this project are NOT on the critical path?
c. How much slack time do these tasks have? What does this mean in terms of project completion?
3. From the View tab select Tables and then Schedule. This view shows early and latest start and finish dates as well as slack time. Does this help your understanding of the time available for each task?
4. In the View tab select Network Diagram and note how the project tasks are represented, and how the dependencies are shown. How does this view add to your understanding of the relationships between tasks of the project?
Tutorial 8 – Activity 3
After this activity your answers to the questions in Steps 3, 6, 7, 9, 10, 11, and 16 should be added to your Project Management Portfolio. You also need an image of your tracking Gantt chart at the end of Step 16.
This activity continues your work with Microsoft Project and adds to your project management knowledge by looking at how change is managed, and the impact different changes have on your project. You might need to refer to the tutorial on Microsoft Project you used in previous tutorials:
Schwalbe, K (2016) A Brief Guide to Microsoft Project Professional 2016
https://kathyschwalbe.files.wordpress.com/2018/08/project2016guide.pdf
In addition to being used as a planning tool, Microsoft Project can be used to track progress and make adjustments to the project schedule. You will use a tracking Gantt chart to help monitor and control work on the Literature Review submission project.
1. Download the file named LiteratureReviewTrackingGantt.mpp from the LMS and open it in Download the file named LiteratureReviewTrackingGantt.mpp from the LMS and open it in Microsoft Project. On the Format tab, click the Critical Tasks checkbox to show the critical tasks in red.
2. On the Project tab, under the Schedule group, click the Set Baseline button and click OK to Set Baseline for the whole project. This is means that you will be able to track the project performance against this initial baseline.
3. Make a note of the projected date for submitting the final report.
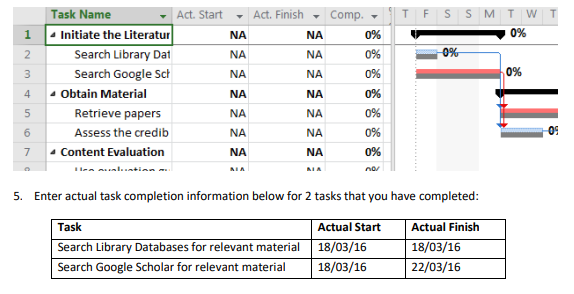
4. Go to the View tab. Select Tracking Gantt from Gantt Chart in the Task Views group. Then from Tables (in the Data group) select Tracking. You should now be able to see columns to enter Actual Start and Actual Finish, and the Gantt chart should show both proposed and actual task.dates together with percentage completion of each task. It should look something like this:
Buy Custom Answer of This Assessment & Raise Your Grades
6. It took an additional day to search Google Scholar beyond the original estimated duration. How does this impact on the tasks that follow? Why?
7. Look at the project finish date. Is the additional day taken to search Google Scholar likely to influence the submission of the final report? If so, how?
8. Enter actual task completion information below for the next 2 tasks that you have completed:
9. It took an additional day to assess the credibility of the sources. How does this impact on the tasks that follow? Does it influence the projected submission date of the final report? If so, how?
10. The tracking Gantt chart also shows percentage completion information. You start the task ‘Use evaluation guides to determine if the article is relevant’ on 30/03/16 and are 30% through it. Enter this information and note how it is displayed on the chart. How far are you estimated to be through the summary level task ‘Content Evaluation’?
11. Switch to Network Diagram view. How are the completed tasks identified?
You are concerned that you may be slipping behind schedule, so after examining your work breakdown structure to identify ways you may be able to save time, you decide that you could probably start work on constructing the concept matrix when you are 75% through the final evaluation of content.
12. Change back to Gantt chart entry view. If you see tracking information instead of the baseline information with predecessors shown, right-click the Select All button (grey unlabelled square in the top left hand), and then click Entry.
13. Double-click on the Task Name for Construct a Concept Matrix of collected Articles, and then click on the Predecessors tab in the Task Information dialog box. Click in the cell under Task Name, and select Final evaluation of content. Click the Type drop down arrow for this task to see the various types of dependencies. For this task the default type, finish-to-start, is used. The Lag
is set to 0d (0 days).
14. A positive Lag means there is a gap between tasks, and negative lag means there is an overlap. Change the lag to -25% and notice that the Predecessor column for the task displays 13FS-25%, meaning there is a finish-to-start relationship with the predecessor task (Final evaluation of content) and a lag of -25%, meaning the task can start when 75% of Final evaluation of content is completed.
15. Does this earlier start impact on the projected completion of the project?
16. Experiment with ways of bringing the project back on track to submit in time. When you identify one plausible way you can do this, both explain it and include the tracking Gantt chart that illustrates it in your PMP report. Note: the tracking Gantt you provide should be a view that shows percentage completion of tasks.
Tutorial 9 – Activity 3
After this activity you should add your Lessons Learned Report to your Project Management Portfolio
This activity concludes your Project Management knowledge by looking at how projects are closed. Throughout each phase, lessons are learned and opportunities for improvement are discovered. In order to continuously improve the success of projects, documenting the lessons learned helps a
project team to identify the causes of problems that occurred and avoid them in later projects.
The objective of a Lessons Learned Report is to collect all the relevant information. Look at the lecture slides from Topic 6 to refresh your memory.
Write a Lessons Learned Report for a project you have worked on. This project could be:
i. An assignment you have done for this unit
ii. An assignment you have done for any other unit
iii. Any project you are able to report on.
Your Lessons Learned Report should include the following sections:
1. Introduction
Briefly describe the project.
2. Achievement of scope and time constraints
Discuss whether the project met scope and time constraints. That is, were you able to do everything that was planned, and finish/submit on time?
3. What went right?
Describe one example of what went right on this project.
4. What went wrong?
Describe one example of what went wrong on this project.
5. Lessons learned
Briefly discuss what the main lessons you learned from this project were. This should include both in terms of managing the project, and in terms of skills that may be useful to you in the future.
6. Implications for the Poster Presentation project
Discuss what you will you do differently on the Poster Presentation project based on your experiences with this and other projects.
Stuck with a lot of homework assignments and feeling stressed ? Take professional academic assistance & Get 100% Plagiarism free papers

- Final Assignment: Migrating FashionOnline’s Infrastructure to AWS: A Strategy for Enhanced Availability and Data Protection
- HRM331: Talent Management – Strategic Shift from the War for Talent to the Wealth of Talent
- Marginalised Populations – The Structural and Cultural Exclusion of People Experiencing Homelessness in Singapore
- CVEN3501 Assignment 2: Groundwater Modelling of Drawdown from a Pumping Bore
- CSCI312 Assignment 2: Conceptual Modelling and Implementation of a Data Warehouse and Hive Queries
- CH2123 Assignment: Fugacity, VLE Modeling & Applications of Henry’s Law
- BAFI1045 Assignment -Constructing and Evaluating Passive and Active Portfolios Based on the Straits Times Index (STI)
- FIN2210E/FIN2212E Group Assignment: Financial Risk Management Analysis of Bursa Malaysia Companies
- FLM101 Assignment: A Film Analysis: Stylistic Techniques and Their Thematic Importance
- HRM Assignment Answer: Talent Transformation in the Age of AI: Turning Challenges into Opportunities via Ecosystem Innovation
UP TO 15 % DISCOUNT